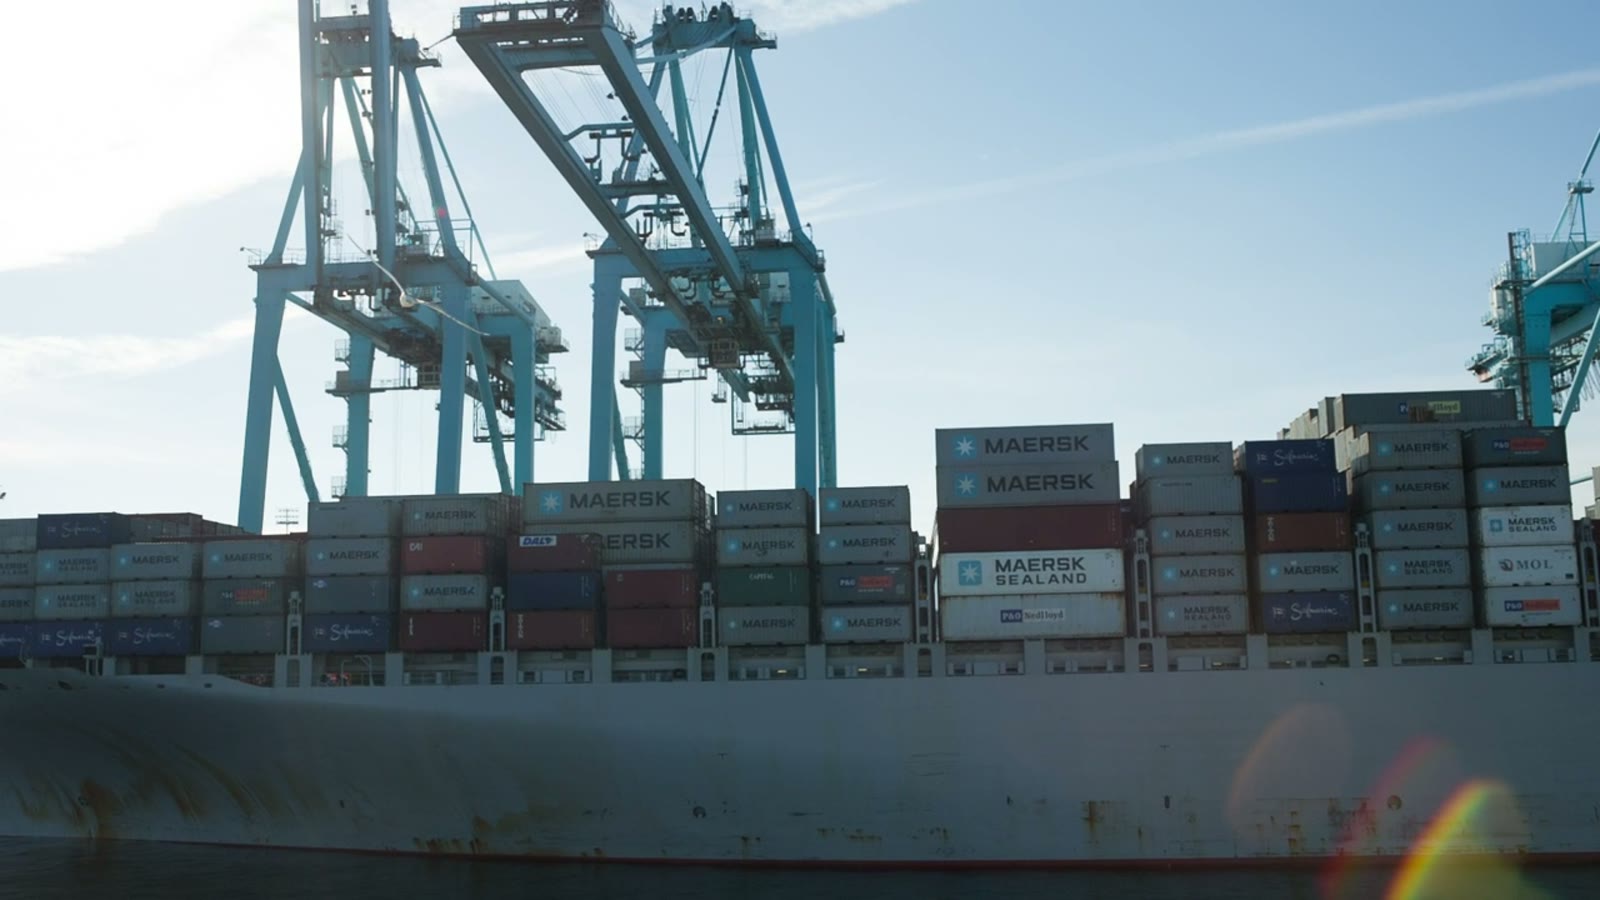
On the morning of 6 July 2025, the Greek-owned bulker Magic Seas took multiple missile and sea drone hits in the southern Red Sea roughly 94 nautical miles southwest of Hodeidah. By evening the crew had abandoned ship to a nearby merchantman and the vessel was listing heavily. It sank two days later. The Houthis claimed the attack the same afternoon, called the vessel a legitimate target for its operator’s prior port calls into Israel, and put every chemical shipper who had quietly started re-routing boxes through Suez on notice: the May ceasefire was over.
Forty-eight hours after that, the Panama Canal Authority published its weekly transit report confirming Gatun Lake at 86.6 feet and the full 50-foot draft restored across all locks. The dry season had broken, the reservoirs had refilled through La Nina rains, and Neopanamax slots were back to 36 per day. The canal the industry had written off as structurally capacity-constrained in 2023 and 2024 was, by mid-July 2025, operating at design spec.
Three weeks later, USTR and MOFCOM negotiators walked out of Stockholm on 29 July having extended the tariff truce another 90 days to 10 November. The Geneva formula held. The Section 301 base stayed in place, but the incremental threat that had been hanging over Chinese specialty chemical exports since April was deferred into Q4.
Stitch those three events together and you have the most consequential shipping-route week of 2025 for chemical importers moving volume from China to Australia. Three routes are back on the table, and the relative economics just moved by hundreds of dollars per TEU. This one unpacks the new decision matrix.
The Three Events in One Paragraph
The Magic Seas sinking on 6 July and the subsequent attack on Eternity C on 8 July killed the soft ceasefire that had quietly re-opened Suez transits for roughly 58 days. Carriers who had started testing single sailings through Bab el-Mandeb since late May pulled those slots within 72 hours. Hapag-Lloyd, Maersk, MSC, CMA CGM and COSCO all reconfirmed Cape of Good Hope routing for Asia to Europe and Asia to US East Coast strings by 10 July. That was event one.
Event two: the Panama Canal Authority confirmation on 8 July that Gatun Lake had recovered to 86.6 feet meant the 50-foot draft restriction that had throttled transits through 2023 and much of 2024 was gone. Neopanamax daily transits returned to 36 per day, up from the drought-era low of 22 per day. For chemical importers moving from China Pacific ports to US East Coast or US Gulf, the Panama routing became competitive again against the transpacific-and-rail combo.
Event three: the Stockholm extension on 29 July pushed the China tariff truce to 10 November. No escalation through August or September. The specialty chemical exporters in Zhejiang, Shandong and Jiangsu who had been pricing in scenario premiums since April stood down. FOB China quotes on maleic anhydride, TDI, MDI, and specialty additive lines drifted 3% to 6% lower into late July.
Now the strategic question: if you’re shipping chemicals from China to Australia, or using China-to-global supply chains where Australian landed cost tracks the global pattern, which route wins?
The Route Options in July 2025
| Route | Transit days Ningbo to Melbourne | Indicative USD per 40ft | Risk flags |
|---|---|---|---|
| Direct Asia-Oceania (no Suez or Panama) | 16-22 | 2,400-2,900 | Stable; blank sailing risk in Q3 |
| Via Suez (Asia-Europe feeder, Melbourne transhipment) | 38-45 | 3,600-4,200 | Houthi attack risk restored post-6 July |
| Via Cape of Good Hope (Asia-Europe, Melbourne transhipment) | 48-55 | 3,900-4,500 | Stable but longer, higher bunker cost |
| Via Panama (Asia-US East Coast, Melbourne transhipment) | 42-50 | 3,700-4,300 | Stable; draft restored 8 July |
The direct routing dominates for pure China-to-Melbourne flows, so the Suez versus Cape versus Panama question only matters if you’re consolidating with European or US East Coast volume, or if your supplier’s logistics partner is pricing you off a global string.
Why Suez Just Became Uninvestable Again
For roughly eight weeks, carriers were testing a limited Suez re-opening. Hapag-Lloyd had two transits in June. MSC ran three. The logic was that Houthi targeting had narrowed and insurance premiums had come down to around 0.7% to 0.9% of cargo value, manageable for most cargoes.
The Magic Seas sinking and the Eternity C attack changed the underwriting maths in one week. Lloyd’s war risk premiums for Red Sea transit roughly doubled by 12 July. The Joint War Committee reconfirmed the Listed Area designation. Carrier boards who had authorised test transits in May and June issued blanket instructions back to Cape routing by mid-July.
If you’re quoting a China to Europe container at FOB Ningbo plus sea freight, the Suez saving against Cape of Good Hope was roughly US$450 per 40-foot. That saving is now offset by:
- War risk insurance uplift of US$180 to US$250 per 40-foot
- K&R cover supplement on crewed and higher-value cargo
- Speed premium on the transit (carriers running Suez now run higher speed for shorter exposure, burning more bunker)
- Operational contingency reserves carriers are pricing in
Net of those, Suez is at best cost-neutral against Cape and carries meaningful tail risk on any specific voyage. For the next 90 days, plan on Cape routing as the baseline for Asia-Europe. If your supplier’s logistics partner is quoting you off a Suez assumption, challenge it.
Why Panama Is Suddenly Interesting Again
The 2023-2024 Panama Canal drought produced one of the most persistent capacity shocks in modern shipping history. From a normal 36 daily transits the canal dropped to 22 at the worst point in late 2023. Auction slot prices spiked above US$2.4 million for a single Neopanamax passage at the peak. Asia-US East Coast services rerouted via Suez. US Gulf chemical imports got squeezed.
The July 2025 restoration matters for three reasons:
One: Asia to US East Coast via Panama is price-competitive again. The spot rate for a Neopanamax transit is back in the US$380,000 to US$520,000 range depending on auction versus reservation. Total route economics Shanghai to Savannah or Houston are now within 4% to 7% of the drought-normal baseline.
Two: US Gulf chemical import routing normalises. Houston Ship Channel was the pressure point of the 2023-2024 drought because the alternative was Asia to US West Coast then rail across. Rail capacity was already strained. Chemical importers landing phenol, maleic anhydride, and specialty solvent volume into Houston paid both a Panama capacity premium and a rail surcharge. Both of those are unwinding through Q3 2025.
Three: Backhaul economics for Latin America to Asia open up. For Australian importers sourcing specialty chemistry that transits Latin American ports for processing (lithium chemistry, some rare earth precursors via Mexico), the Panama routing is now flowing in both directions at normal speed.
For a direct Melbourne flow, Panama doesn’t enter the picture. For an Australian importer whose Chinese supplier is landing part of their volume into US Gulf for blending and then reshipping, the Panama unwind shows up in your FOB China quote as roughly US$40 to US$90 per tonne of landed savings on high-volume commodity chemistry lines over the next two quarters.
Stockholm and the Specialty Chemical Pricing Response
The Stockholm extension on 29 July matters less for the tariff rate itself (unchanged from May Geneva) and more for the duration signal. Two 90-day extensions now. The market reads this as the negotiating teams having a framework they can operate within, and the escalation risk through to November being low.
What that did to Chinese specialty chemical FOB quotes through the back half of July:
| Product family | FOB Ningbo early July USD/MT | FOB Ningbo end July USD/MT | Change |
|---|---|---|---|
| MDI polymeric | 1,680 | 1,615 | -3.9% |
| TDI 80/20 | 2,440 | 2,355 | -3.5% |
| Maleic anhydride | 1,130 | 1,085 | -4.0% |
| Phenol | 1,050 | 1,005 | -4.3% |
| Acrylic acid glacial | 1,280 | 1,220 | -4.7% |
| Specialty amine blends | 3,600-4,200 | 3,430-4,030 | ~4.0% |
| Polyol (flexible foam grade) | 1,520 | 1,465 | -3.6% |
These are indicative prints, not published benchmarks. The direction and the magnitude are what matter. The risk premium that had been built into Chinese quotes from April through June came out in a three-week window post-Stockholm.
If you’re buying into August loading out of Wanhua, Sinopec Yangzi, or the mid-tier Zhejiang specialty houses, this is your negotiating leverage window. Suppliers who had been holding the April-May spike price into July contracts will soften if you show them the end-July market prints and push for a Q3 refresh on your annual contract terms.
The Landed Cost Build for a Typical Australian Chemical Import
Work a specific example. You’re importing 2,200 MT of polymeric MDI from Wanhua Yantai to Melbourne for Q3 delivery. Three scenarios:
Scenario A: June quote, pre-Stockholm, Suez assumption in the carrier’s network design.
- FOB Ningbo: US$1,680 per MT x 2,200 = US$3,696,000
- Sea freight via direct Asia-Oceania string: US$2,700 per 40-foot x 110 containers = US$297,000
- Insurance at 0.35% of CIF: US$13,977
- Australian customs duty at 5% on CIF: US$200,348
- GST at 10% on CIF plus duty: US$420,732
- Total landed Melbourne: US$4,628,057
Scenario B: End-July quote, post-Stockholm, stable direct routing.
- FOB Ningbo: US$1,615 per MT x 2,200 = US$3,553,000
- Sea freight direct: US$2,550 per 40-foot x 110 containers = US$280,500
- Insurance at 0.35%: US$13,417
- Customs duty at 5%: US$192,346
- GST at 10%: US$403,927
- Total landed Melbourne: US$4,443,190
Scenario C: End-July quote, supplier trying to push a Cape of Good Hope premium into the freight line.
- FOB Ningbo: US$1,615 per MT x 2,200 = US$3,553,000
- Sea freight quoted on Cape assumption: US$3,200 per 40-foot x 110 containers = US$352,000
- Insurance at 0.35%: US$13,608
- Customs duty at 5%: US$195,930
- GST at 10%: US$411,453
- Total landed Melbourne: US$4,525,991
The delta between Scenario A and Scenario B is US$184,867 across a single Q3 delivery. That is the combined value of the Stockholm FOB softening and the direct routing that was always available but sometimes priced opaquely.
The delta between Scenario B and Scenario C is US$82,801. That is what happens when your supplier or your forwarder prices the freight line against a global reroute assumption that doesn’t apply to your Melbourne flow. If you’re not challenging the freight line against a direct-string benchmark, you’re leaving this number on the table.
The Operational Read-Through for Q3 and Q4
Plan the rest of the year around three operating assumptions:
One: Red Sea stays hot through Q4. The Magic Seas attack was not opportunistic. The Houthis signalled capability and intent in one week. No responsible carrier will put vessels back through Bab el-Mandeb at scale before a durable political settlement, which is not on the Q4 calendar. Suez is a paper option, not a real one.
Two: Panama operates to design spec. La Nina rainfall has refilled Gatun Lake. The Canal Authority has infrastructure plans funded through 2028. Plan your US Gulf and US East Coast transit assumptions on 50-foot draft, 36 daily transits, no auction premium above US$520k except in acute surge periods. Your Chinese supplier’s US-facing logistics costs should be easing through Q3.
Three: China tariff truce holds to at least 10 November. Whether it extends again into Q1 2026 is a separate question. For Q3 and most of Q4 planning, operate on the assumption that Section 301 rates are stable and no additional reciprocal tariffs hit Chinese specialty chemistry. FOB China quotes should continue to drift lower as the urgency premium unwinds. Push for mid-quarter contract refreshes if your annual terms were struck in the April-May spike.
Risks the Optimistic Read Misses
Three things can break this setup:
Iran escalation. The Houthis are a proxy. A direct Iran-Israel exchange would spike Strait of Hormuz risk and reprice bunker globally. If Brent crude moves through US$95 on a geopolitical shock, every freight line in your landed cost build moves with it.
Panama second dry season. La Nina rainfall saved the canal through H1 2025, but climate variability means a return to drought conditions is never more than one season away. If Gatun Lake drops below 79 feet through Q4, the draft restrictions come back on. Build contingency.
Tariff truce collapse at 10 November. If the Geneva formula doesn’t hold into a third extension, the FOB China price softening reverses in days, not weeks. Watch the USTR-MOFCOM communiques through late October. Don’t carry more than a fortnight of unfixed spot exposure into the first week of November.
What to Do This Month
- Pull your Q3 and Q4 shipping bookings from your forwarder. Ask explicitly whether the freight quote is built on a direct Asia-Oceania string, a Cape-adjusted string, or a global network charge. Challenge any Cape premium pushed through on Melbourne-direct flows.
- Retender your Chinese specialty chemistry contracts for Q4 loading. Use the end-July FOB prints as your anchor. Target a 3% to 5% reduction on rolling annual terms.
- If you have US Gulf or US East Coast volume in your supply chain, audit the Panama routing assumption. Ask your supplier for a cost breakdown reflecting the restored 50-foot draft.
- Build a tariff-truce-collapse scenario for early November. Know which of your contracts give you enough flexibility to reposition volume and which lock you into an exposed price.
- Keep Red Sea out of your baseline assumption. If a carrier offers you a Suez saving on an Asia-Europe flow, treat it as speculative until the regional risk picture changes materially.
The last three weeks of July 2025 compressed what would normally be a half-year of route-economics and pricing evolution into a single window. Australian importers who rebuild the landed cost model around the new operating reality will close Q3 well. Those who carry April-May assumptions into September won’t.
When you want a working session on your open book against this matrix, we’ll run the scenario maths line by line with you. Send us the bookings and the FOB quotes and we’ll show you where the value is, and where the hidden premium is hiding.