$268.07 billion. In one month. That is what GACC reported for China’s November 2020 exports, up 21.1% year-on-year and the best single monthly export number China had ever recorded to that point. Back in March, when factories were dark and containers were stacking up at Shanghai and Ningbo, nobody would have predicted you would end the year here. For US procurement managers sourcing industrial chemicals and raw materials from China, this number matters enormously because it is the last major data point before your Q1 2021 planning locks in.
Here is what the figure actually tells you, what it does not tell you, and how to use it in your planning before the Chinese New Year window closes.
What Drove the November Record and Why It Matters for Your Category
The surge was not uniform across sectors, and that distinction shapes how you read the implications for your specific chemical categories.
Electronics led in absolute volume, particularly laptops, tablets, and mobile devices. The work-from-home economy that took hold globally in Q2 never reversed, and China was the dominant supplier of the hardware supporting it.
PPE continued contributing meaningfully, though its share had moderated from the extraordinary Q1 and Q2 peaks. Medical supplies stayed above pre-COVID run rates as healthcare systems globally continued building reserves.
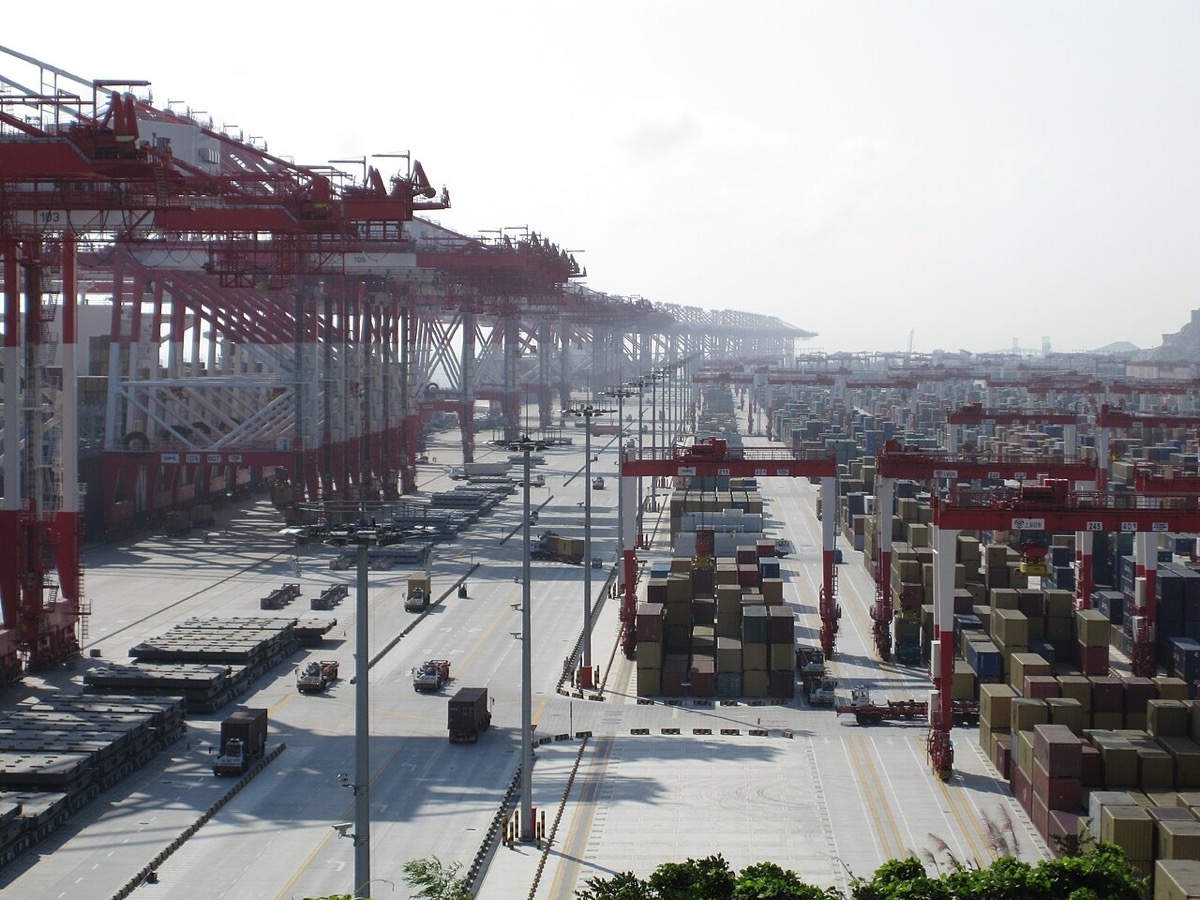
Recovering industrial goods, including chemicals, were the third significant driver. Factory capacity across Jiangsu, Zhejiang, Shandong, and Guangdong had returned to pre-COVID levels by Q3. By November, plants were running at full or near-full utilisation for most specialty and commodity chemical categories. Lead times that had stretched to 12 to 16 weeks during the disruption period had come back down toward 8 to 10 weeks for most standard lines.
The November figure confirms something procurement teams had been trying to verify all year: the recovery was real and the capacity was actually there. If your Chinese supplier was still quoting constrained availability in November or December 2020, that was a negotiating tactic, not a structural supply problem.
The Full-Year Surplus: What $523.99 Billion Tells You About Your Q1 Negotiating Position
The full-year 2020 trade surplus came in at $523.99 billion. The 2019 full-year figure was $421.9 billion. That is a $102 billion increase in a single year, the largest annual surplus expansion in China’s modern trade history, and it happened during a global pandemic.
| Year | Full-Year Trade Surplus | Year-on-Year Change |
|---|---|---|
| 2019 | $421.9 billion | baseline |
| 2020 | $523.99 billion | +$102.1 billion (+24.2%) |
The mechanism is straightforward in retrospect. China brought its manufacturing sector back online faster than any other major economy, met the surge in goods demand that replaced services spending globally, and captured export share from competitors still managing COVID disruption.
For US chemical importers, the practical implication is that Chinese exporters entered 2021 from a position of strength. They were not desperate for orders. European buyers were active, Asian domestic demand was recovering, and the US remained a significant destination despite Section 301 tariff friction. Suppliers with full order books had very limited incentive to offer pricing concessions to individual US buyers.
If you were planning to use “slow global demand” as justification to push supplier prices down in Q1 2021, the $523.99 billion number killed that argument. The data was public. Your supplier knew it, and so did every other buyer at the table.
Why the Surplus Made Section 301 Relief Politically Impossible
Section 301 tariffs across List 1, List 2, and List 3 stayed at 25% as of December 2020. List 4A sat at 7.5%. No relief had been signalled by the outgoing Trump administration, and the incoming Biden team had given no indication during the transition that tariffs were an early priority for reversal.
The surplus data made the political environment for tariff relief far more difficult. When the US bilateral trade deficit with China is at historic highs and the surplus is a record, any administration that reduces tariffs opens itself to the accusation of rewarding that imbalance. The $523.99 billion full-year surplus, once published in January 2021, became a recurring data point for tariff hawks in both parties throughout 2021 and beyond.
For your planning purposes, treat Section 301 rates as a fixed cost for 2021. Not temporary. Not negotiable at the policy level. Plan your sourcing volumes accordingly.
Q1 2021 Procurement Planning: What the Calendar Tells You to Do Now
Availability in Q1 2021 was going to be solid. Both the capacity utilisation data and the export figures confirmed that. Lead time risk was lower than at any point in 2020. However, Q1 is always complicated by Chinese New Year, which in 2021 fell on February 12. The typical factory shutdown window runs from late January through early March as workers travel home and return.
| Order Placement Date | Expected Vessel Departure | US Arrival (35-day transit) | Inventory Available By |
|---|---|---|---|
| December 20, 2020 | January 10, 2021 | February 14, 2021 | Before CNY shutdown |
| January 5, 2021 | January 25, 2021 | March 1, 2021 | Just as factories restart |
| January 15, 2021 | February 1, 2021 | March 8, 2021 | Post-CNY period |
| February 15, 2021 | March 10, 2021 | April 14, 2021 | Full Q2 availability |
If your Q1 production schedule needed chemical raw materials arriving before mid-February, orders needed to be placed in December 2020 at the latest. This is not a soft suggestion. It is a deadline calculation, and missing it meant Q1 inventory gaps.
Freight: Why Q4 2020 Shipping Costs Changed Your Q1 Model
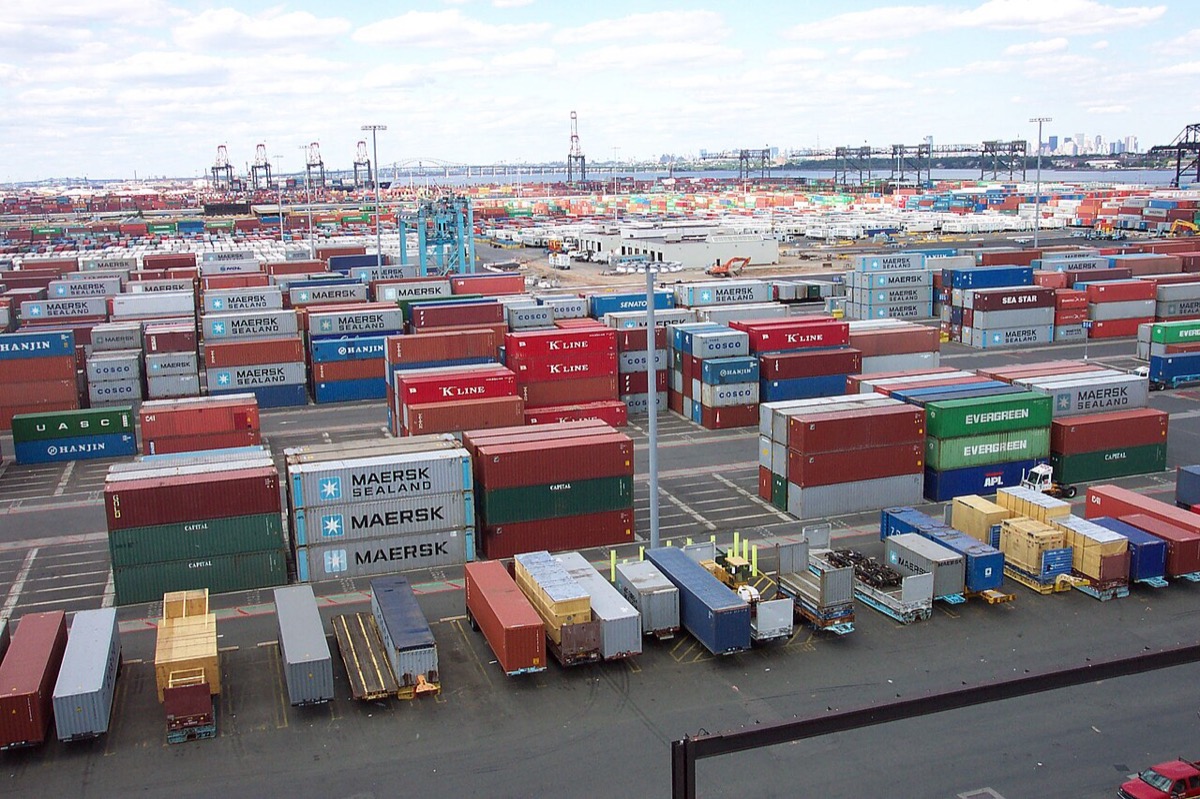
The November export surge did not happen in a friendly shipping environment. China to US West Coast freight rates had been rising sharply since August 2020, driven by strong export volumes, equipment imbalances from the COVID disruption period, and port congestion on both coasts.
The Shanghai Containerised Freight Index for US West Coast lanes was trading above $3,800 per TEU by mid-December 2020, compared to roughly $1,600 in the same period in 2019.

For 2021 planning, model freight costs at elevated rates for at least H1. Using 2019 freight benchmarks in your landed cost model was a significant error in this environment. The freight line in your cost model needed to reflect actual market rates, which in practice meant two to three times the pre-COVID baseline for many China-to-US lanes.
What the Record Surplus Signals About Political Pressure on China Trade
The $523.99 billion full-year 2020 surplus was not just a trade statistic. It was a political fact that shaped the tariff environment for 2021 and beyond. China’s record surplus in a year when US manufacturing and services were under severe COVID stress created an asymmetry that was politically impossible to ignore. US manufacturers were struggling while Chinese exporters were posting their best year on record. That asymmetry fed directly into the bipartisan political consensus against reducing tariffs that characterised the first half of 2021 under Biden.
The companies that planned accordingly in December 2020, treating tariffs as a permanent line item rather than a temporary adjustment, made better procurement decisions than those that waited for relief that never came. Start your Q1 planning with that assumption locked in. Lock in volumes before Chinese New Year deadlines close the window. Build your landed cost model on actual December 2020 freight rates, not 2019 benchmarks. The November export record tells you exactly what the supplier landscape looks like. Plan around it.